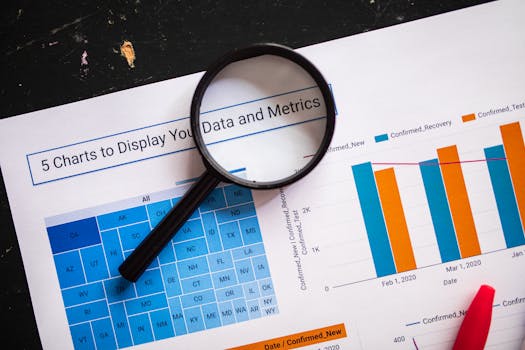
Improving Your Data Presentation Skills with Visualization Tools
Presenting data effectively is more crucial than ever. In a world where information overload is the norm, the ability to translate raw numbers into compelling, easily digestible visuals can set you apart—whether in business meetings, academic research, journalism, or public policy. But mastering this skill requires more than simply choosing a chart type; it demands a strategic approach, a keen understanding of your audience, and familiarity with the latest visualization tools. This article explores how you can elevate your data presentation skills by leveraging modern visualization platforms, tailoring your visuals to purpose, and adopting best practices that go beyond basic charting.
Why Data Presentation Skills Matter in the Information Age
Effective data presentation is no longer an optional skill. According to a 2023 survey by the Data Visualization Society, 78% of professionals said that clear visualizations improved their ability to make data-driven decisions. Yet, a staggering 61% admitted their organizations often misinterpret charts or graphs due to poor design or inappropriate choice of visuals. The stakes are high—misunderstood data can lead to costly business mistakes, flawed research outcomes, or public misinformation.
Consider the following real-world implications: - In healthcare, a poorly designed chart could obscure critical trends in patient outcomes. - In finance, unclear visualizations could mislead investors about market performance. - In education, confusing graphs may hinder student understanding and retention.By honing your data presentation skills and using the right visualization tools, you not only convey information more effectively but also influence decisions, drive engagement, and inspire action.
.png)
Understanding Different Types of Visualization Tools
Today’s market offers a wide array of visualization platforms, catering to diverse needs and skill levels. The right tool can make the difference between a forgettable slide and a memorable, actionable insight. Here’s a breakdown of some leading options, along with their unique strengths:
| Tool | Best For | Ease of Use | Key Features | Cost |
|---|---|---|---|---|
| Tableau | Business Analytics | Intermediate | Interactive dashboards, real-time data, extensive integrations | From $70/month |
| Power BI | Enterprise Reporting | Intermediate | Integration with Microsoft products, AI features | From $10/month |
| Google Data Studio | Collaborative Reporting | Beginner | Real-time collaboration, free, Google ecosystem | Free |
| Infogram | Infographics & Social Media | Beginner | Templates, drag-and-drop, embeddable charts | From $19/month |
| D3.js | Custom, Interactive Web Visualizations | Advanced | Complete customization, open source | Free |
Choosing the right tool depends on your technical comfort, the complexity of your data, and the specific goals of your presentation. For instance, a beginner may start with Google Data Studio or Infogram, while advanced users might create bespoke, interactive web visualizations using D3.js.
Tailoring Visualizations to Your Audience and Purpose
One of the most common mistakes in data presentation is adopting a “one-size-fits-all” approach. The best data communicators carefully consider their audience and the context in which the data will be consumed.
Audience considerations: - Executives may prefer high-level summaries and key trends, often in the form of dashboards or infographics. - Technical teams might require granular, interactive data with the ability to drill down into details. - The general public benefits from simple, visually engaging graphics that highlight one or two central messages. Purpose considerations: - Are you trying to persuade, inform, or prompt action? - Is the data intended for live presentations, static reports, or interactive web applications?For example, a 2022 study by Nielsen Norman Group found that infographics increased audience retention of key facts by 47% compared to text-only reports, especially when tailored to the viewers' background knowledge.
Key tip: Before creating any visualization, define your core message in one sentence. Let this statement guide which data to include, what type of chart or graphic to use, and how much detail is appropriate.
Beyond Bar and Pie Charts: Expanding Your Visualization Repertoire
While bar charts, line graphs, and pie charts are classics for a reason, modern visualization tools allow you to go far beyond these basics. Exploring a broader range of visual formats can uncover hidden insights and present your data in more engaging ways.
Here are some advanced visualization types and their best use cases: - Heatmaps: Excellent for showing intensity or density, such as website click activity or geographic data. - Sankey diagrams: Ideal for illustrating flows, like energy transfer or user journeys through a website. - Treemaps: Useful for displaying hierarchical data, such as company structures or budget breakdowns. - Bullet charts: Summarize performance against benchmarks in a compact space. - Network graphs: Reveal connections and relationships, such as social networks or information flows.The key is not to use the most complex chart, but the one that best clarifies your point. According to a 2021 Gartner report, organizations that adopted varied visualization types saw a 22% improvement in cross-team data understanding.
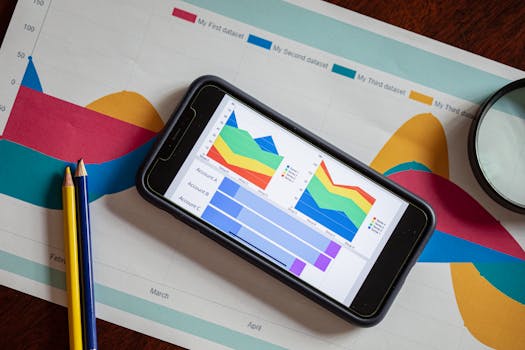
Leveraging Interactivity and Real-Time Data
Static charts have their place, but interactive visualizations can provide a deeper level of engagement and understanding. With modern tools, you can add features such as hover-over details, filters, drill-downs, and real-time data updates—allowing your audience to explore the data for themselves.
Benefits of interactive visualization: - Empower users to answer their own questions on the fly. - Reduce information overload by letting viewers focus on the data most relevant to them. - Showcase dynamic trends, such as live financial data or website analytics.For example, Power BI and Tableau both offer robust interactive dashboard capabilities. In 2023, LinkedIn reported that posts containing interactive data dashboards garnered 2.4 times more engagement than those with static images.
Common Pitfalls in Data Presentation and How to Avoid Them
Even with the best tools, it’s easy to fall into traps that undermine your message. Here are some common pitfalls and strategies to avoid them:
1. Overcomplicating visuals: Crowded charts with too many variables or colors confuse more than they clarify. Stick to one main idea per visualization. 2. Ignoring accessibility: About 8% of men and 0.5% of women worldwide have color vision deficiency. Always check your visuals for colorblind-accessible palettes and use patterns or labels to differentiate when possible. 3. Skipping data context: A chart without explanation can mislead. Always include clear titles, labels, and a brief description of what the data represents. 4. Misrepresenting data: Truncated axes or cherry-picked data ranges can distort reality. Be transparent and consistent in how you present data.A 2022 MIT study found that 32% of business reports contained at least one misleading chart element, often unintentionally. Regularly reviewing your visuals for clarity, accuracy, and fairness is essential to maintain trust.
Conclusion: Elevate Your Impact Through Better Visualization
Improving your data presentation skills is more than just learning to make prettier charts—it’s about transforming complex information into clarity, insight, and action. By thoughtfully selecting visualization tools, tailoring your approach to your audience, exploring diverse chart types, embracing interactivity, and steering clear of common pitfalls, you can significantly boost your effectiveness as a data communicator.
As the volume and complexity of information continue to grow, those who master the art and science of data visualization will be in high demand—able to influence decisions, educate, and drive innovation across every sector.